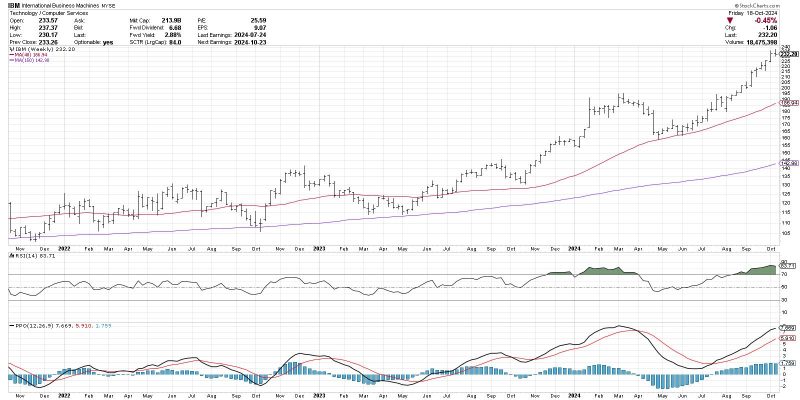
The Moving Average Convergence Divergence (MACD) histogram has long been a popular tool among technical analysts for predicting trend changes in financial markets. As a derivative of the MACD indicator, the histogram offers traders additional insights into the strength and momentum of price trends. By analyzing the behavior of the MACD histogram, traders can potentially gain an edge in anticipating market shifts and making informed trading decisions.
The MACD histogram is a visual representation of the difference between the MACD line and the signal line. It consists of vertical bars that oscillate above and below the zero line, reflecting the relationship between short-term and long-term moving averages. When the histogram bars are above the zero line, it indicates that the short-term moving average is above the long-term moving average, signaling a bullish trend. Conversely, when the bars are below the zero line, it suggests a bearish trend.
One key feature of the MACD histogram is its ability to identify divergences between price and momentum. Divergences occur when the price of an asset moves in one direction while the MACD histogram moves in the opposite direction. This discrepancy can signal potential trend reversals or weaknesses in the current trend, providing traders with an early warning sign to adjust their positions accordingly.
Another valuable aspect of the MACD histogram is its sensitivity to changes in market momentum. As the histogram bars fluctuate in height, they can reveal shifts in the strength of the prevailing trend. For example, a series of increasing histogram bars indicates rising momentum and confirms the current trend, while a divergence between price and the histogram suggests a possible weakening of the trend.
Traders often use the MACD histogram in conjunction with other technical indicators to validate their trading signals and reduce false alarms. The convergence of signals from different indicators can enhance the accuracy of trend predictions and improve risk management practices. Additionally, incorporating fundamental analysis and market sentiment into the decision-making process can provide a comprehensive understanding of market dynamics and improve overall trading performance.
In conclusion, the MACD histogram is a powerful tool that can help traders anticipate trend changes and make informed trading decisions. By carefully monitoring the behavior of the histogram and interpreting its signals in the context of broader market conditions, traders can gain a competitive advantage and enhance their profitability in financial markets. While no indicator can guarantee success in trading, the MACD histogram offers valuable insights that, when used judiciously, can significantly improve trading outcomes.
