**Body**
**Overview of the RRG Velocity Indicator**
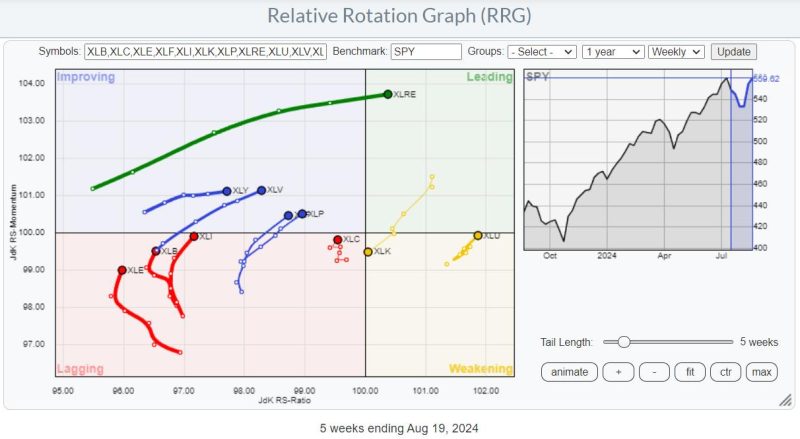
The Relative Rotation Graph (RRG) Velocity indicator is a powerful tool used by investors and traders to identify potential trading opportunities. It measures the speed at which a security or sector is moving relative to a benchmark, providing valuable insights into market trends and potential shifts.
**Key Features of RRG Velocity**
1. **Identifying Strength and Weakness**: The RRG Velocity indicator helps traders identify sectors or securities that are gaining or losing momentum relative to a benchmark. This allows traders to focus on assets that are exhibiting strong trends and potentially outperforming the broader market.
2. **Detecting Trend Reversals**: By analyzing the velocity of different sectors or securities on the RRG graph, traders can spot potential trend reversals before they occur. This can be a valuable tool for anticipating market movements and adjusting trading strategies accordingly.
3. **Assessing Risk and Reward**: The RRG Velocity indicator also helps traders assess the risk and reward of different assets. By comparing the velocity of securities against a benchmark, traders can determine which assets offer the best potential returns relative to their risk profile.
**Application in Trading**
1. **Sector Rotation Strategies**: Traders often use the RRG Velocity indicator to implement sector rotation strategies. By identifying sectors that are gaining momentum and rotating out of underperforming sectors, traders can capture potential profits as market trends shift.
2. **Dynamic Asset Allocation**: The RRG Velocity indicator can also be used to inform dynamic asset allocation decisions. By monitoring the velocity of different asset classes, traders can adjust their portfolio allocations to capitalize on emerging market trends and opportunities.
3. **Risk Management**: In addition to identifying trading opportunities, the RRG Velocity indicator can also help traders manage risk. By avoiding assets with declining velocity or high volatility relative to a benchmark, traders can mitigate potential losses and preserve capital.
**Limitations and Considerations**
1. **Volatility**: The RRG Velocity indicator may be sensitive to short-term fluctuations in market volatility, which can impact the accuracy of trend signals. Traders should consider combining RRG Velocity with other technical indicators for more robust analysis.
2. **Benchmark Selection**: The choice of benchmark used in the RRG Velocity calculation can significantly impact the results. Traders should carefully select an appropriate benchmark based on the specific market conditions and assets being analyzed.
3. **Confirmation Signals**: While the RRG Velocity indicator can provide valuable insights into market trends, traders should always seek confirmation from additional sources to validate their trading decisions. Combining RRG Velocity with fundamental analysis and other technical indicators can enhance the reliability of trading signals.
**Conclusion**
In conclusion, the RRG Velocity indicator is a powerful tool that can help traders identify trading opportunities, detect trend reversals, and manage risk effectively. By understanding the key features of the indicator, applying it in trading strategies, and considering its limitations, traders can leverage the RRG Velocity indicator to make informed and strategic investment decisions in dynamic market environments.
