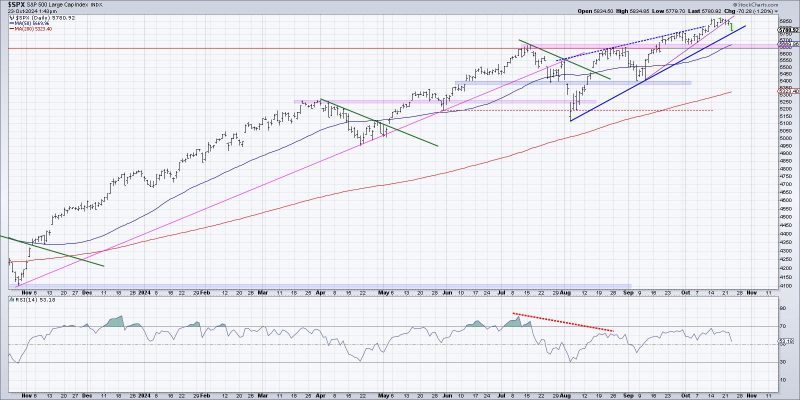
**Analyzing the Beginning of a Potential Distribution Phase**
In the world of financial markets, identifying key patterns and trends can be crucial for making informed investment decisions. One such important phase that traders and investors often keenly observe is the potential distribution phase. This phase indicates a shift from the accumulation phase, signaling a possible change in market sentiment. Here are three effective ways to visualize and analyze the start of a potential distribution phase:
**Volume Analysis**
Volume analysis is a fundamental method utilized by technical analysts to evaluate market trends and predict potential price movements. In the context of a potential distribution phase, monitoring trading volumes can provide valuable insights into the behavior of market participants. An increase in selling volume, particularly following an extended period of accumulation, may indicate the beginning of distribution by large institutional investors. By comparing volume levels to historical averages and observing the relationship between price movements and trading volume, traders can better understand the dynamics underlying a potential distribution phase.
**Price Action and Support Levels**
Another critical aspect of identifying the onset of a potential distribution phase involves analyzing price action and support levels. During the transition from accumulation to distribution, price movements often exhibit distinct patterns that reflect changing market dynamics. Observing the formation of lower highs and lower lows, coupled with increased selling pressure near established support levels, can signal the emergence of distribution activities. Traders who pay attention to these key price action indicators can gain valuable insights into the evolving market sentiment and make informed decisions regarding entry and exit points.
**Technical Indicators**
In addition to volume analysis and price action, utilizing technical indicators can further enhance the ability to visualize the start of a potential distribution phase. Indicators such as the Relative Strength Index (RSI), Moving Averages, and the On-Balance Volume (OBV) can offer valuable signals regarding market momentum and the strength of distribution activities. Traders can leverage these indicators to confirm emerging trends, identify potential trend reversals, and determine optimal entry and exit points during a distribution phase. By combining multiple technical indicators and cross-referencing their signals, traders can develop a comprehensive understanding of the evolving market dynamics and adjust their trading strategies accordingly.
In conclusion, navigating the complexities of potential distribution phases requires a multi-faceted approach that integrates volume analysis, price action interpretation, and technical indicator utilization. By carefully monitoring these key aspects and staying attuned to evolving market trends, traders and investors can effectively visualize the onset of a potential distribution phase and make well-informed decisions to optimize their trading performance.
